Friday, December 16, 2011

12/16/2011 Using Orthophotos

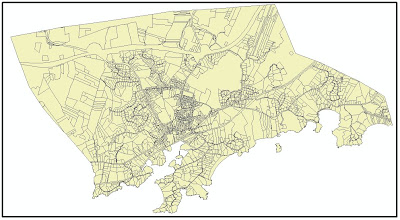
I recently purchased a data set of parcels, streets, elevation contours, and building footprints (shapefiles) for Manchester-by-the-Sea, Mass. The 2,366 parcels look GREAT!

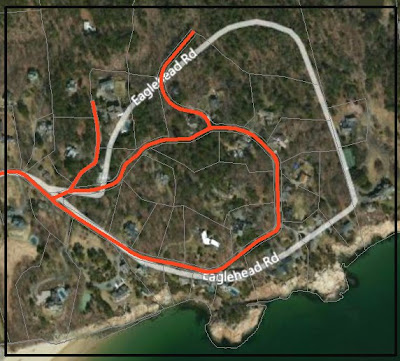
I want them to be transparent, with a nice basemap showing through. When I started with Esri’s “Bing Maps Hybrid”, however, the features were not good enough – their Eaglehead Rd (light gray) does not really line up with the parcels/streets:

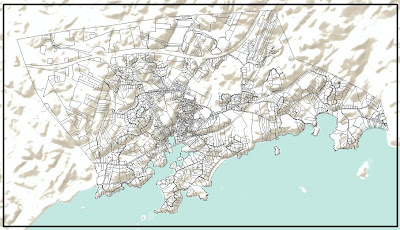
The map made with the Terrain basemap looks fun:

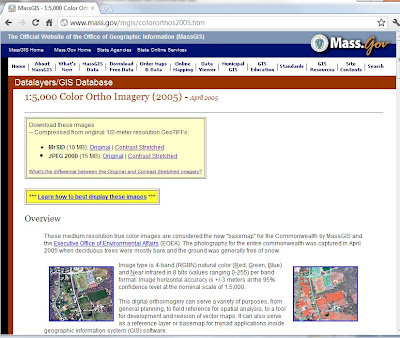
I was hoping for some type of satellite view. The type of photo is called an orthophoto. Any (initial) photo is taken through a single lens, and therefore what you see is an image coming together at a single focal point. In an orthophoto, the image has been corrected (“orthorectified”) so that each point on the photo appears as if you were directly above it (“ortho-“ is a word element meaning “straight”). Orthophotos are available from MassGIS (the Office of Geographic Information) http://www.mass.gov/mgis/colororthos2005.htm

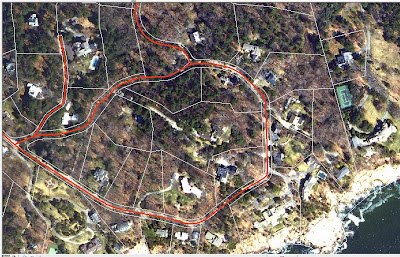
By consulting their index, I downloaded the appropriate 6 zip files in Mr Sid format (“Contrast Stretched” looks best). After unzipping them, I opened them in ArcMap – it looks great!

The size of the orthophotos (1 file = 9.76 megs and covers an area 2.5 miles x 2.5 miles) make this impracticable for areas larger than a town or two, but for that level of analysis/display, they are a very nice layer. And you can’t beat the cost.

Thursday, December 15, 2011

12/15/2011 Solutions – not Problems – With Projections

I felt that the maps in yesterday’s blog looked “squashed” and unrealistic (which, of course, is silly because only a handful of people have been far enough out in space to realistically see the Continental United States!).

“Projection” refers to how the three-dimensional data (our real-world coordinate system on our real-world globe) gets “projected” onto a flat piece of paper (or, in this case, a flat computer screen). I only worry about projections in two circumstances: 1) when the map “doesn’t look right” and 2) when historical boundary files do not line up with current boundary files.

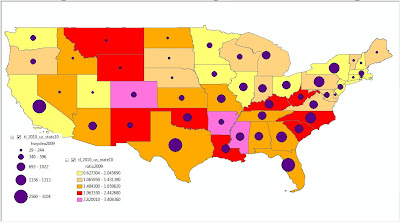
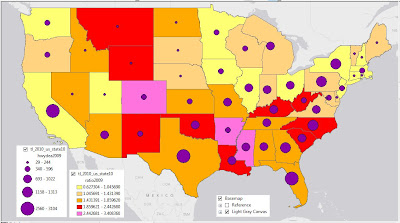
First things first – the top map was created straight from the TIGER 2010 boundary files downloaded from the U.S. Census Bureau, and those files use GCS_North_American_1983 for their Geographic Coordinate System. The nice map below, however, was started by using a basemap from ArcGIS Online – the Light Gray Canvas, which has GCS_WGS_1984 for their Geographic Coordinate System.

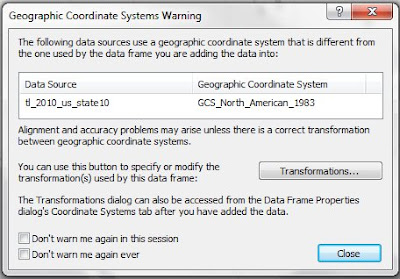
By starting with a layer that has a nice projection (GCS_WGS_1984, in this case), ArcMap will overlay any additional geographic data files (after giving you an appropriate Warning):

The second case of projection problems happens when your data suppliers change their data-delivery projection. This happened to me in the mid-1990’s – prior to 1995, TIGER files used the North American Datum of 1927 (NAD27). Beginning in 1995 (and continuing through today), the TIGER files are referenced to the North American Datum of 1983 (NAD83); as a result, historical boundaries no longer lined up, and an entire set of Mapping Data had to be created anew (streets, Census Tract boundaries, Block Groups, Counties, Water, etc.).

In summary, if it looks good, you are fine. But if it looks bad, investigate your projection(s).

Wednesday, December 14, 2011

12/14/2011 NTSB recommended cell phone ban – How Safe is Your State?

Press Release: The NTSB voted unanimously today [December 13, 2011] for a nationwide ban on the nonemergency use of portable electronic devices (other than those designed to support the driving task) for all drivers.

This is certainly in response to the December 8, 2011 Press Release from the National Highway Traffic Safety Administration [NHTSA] stating that although highway deaths fell to 32,885 in 2010 (from 33,883 in 2009), 3,092 were in “distraction-affected crashes”.

The National Traffic Safety Board is an Independent United States Federal Government Agency charged with determining the probable cause of transportation accidents and promoting transportation safety.

I am wondering “how safe is Massachusetts” in regard to other states, at least as far as traffic accidents are concerned?

The NHTSA December 2011 issue of Traffic Safety Facts
link to the issue
lists Total Fatalities, 2009 and 2010, by State in Table 8.

The NHTSA works with the Fatality Analysis Reporting System (FARS) which provides yearly data regarding fatal injuries suffered in motor vehicle traffic crashes.

The Research and Innovative Technology Administration (RITA) coordinates the U.S. Department of Transportation’s research programs, and has a division called the Bureau of Transportation Statistics (BTS) which publishes Number of U.S. Vehicles – total Highway registered vehicles were 254,212,610 in 2009.

The Federal Highway Administration (another part of the U.S. Department of Transportation) issues Table MV-1 each year (data for 2009 was issued January 2011), which lists, by State, Motor Vehicle Registrations – this means that instead of saying, in 2009, “the whole US had 33,883 highway deaths, distributed over 254,212,610 registered vehicles”, we can show the distribution spatially, state by state:


This first map shows count of deaths in each state – California, Texas, and Florida have the highest counts, followed by Georgia, New York, North Carolina, and Pennsylvania.

But I am not really a fan of “raw count” data – how does it relate to the number of vehicles registered in each state? The ratio2009 numbers are deaths per state/registrations per state, multiplied by 10,000, and they show California, Texas, and Florida as “not that dangerous”:


But now stay away from Arkansas, Colorado, and Mississippi!

One wonderful aspect of GIS/Computer Cartography is that you can display two (or more) sets of data at once. Working from the ratio2009 map, I added the raw count of highway deaths (as a graduated circle):

Is Massachusetts safe? With 340 highway deaths, 17 other states have fewer fatalities. But, with 5,420,020 vehicles registered, and 340 highway deaths, Massachusetts actually has the lowest deaths-per-registered-vehicle number in the United States!
Friday, December 9, 2011

12/9/2011 Traffic Cams, part 2

A quick follow-up on yesterday’s “Traffic Cams” post. I am trying to keep my code-writing “skills” buried, so I like clicking/double-clicking/cut-and-paste. I made a spreadsheet of the four traffic cams, but I needed their Latitude/Longitude coordinates (or so I thought).

To get the Latitude/Longitude, I open ArcGIS Online
ArcGIS Online
(note: you do not need to Sign In for this feature)

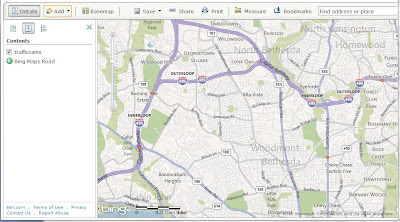
Click Map, then change the BasemapBasemap to Bing Maps Road. Zoom-in on the area north of Washington, DC. Click the Measure button, then click the Location tool.

Position your cursor over the intersection of I-495 and River Rd and Latitude/Longitude appear on the fly (work off the Camera Locations map identified in yesterday’s blog):

Fill in the spreadsheet for the four cameras, and copy-and-paste their urls:

Highlight the 20 cells and Save As TrafficCams.csv
In ArcGIS Online, close the Measure box. Click the Add button, then click Add Layer from File:

Go choose the csv file, then click the Import Layer button. The file is uploaded, and the program determines the locations from the Latitude/Longitude fields, and zooms appropriately:

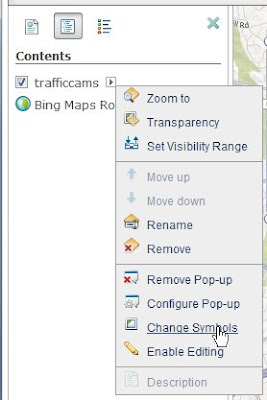
Change the symbols by clicking the little arrow in the Contents and going down and selecting Change Symbols:

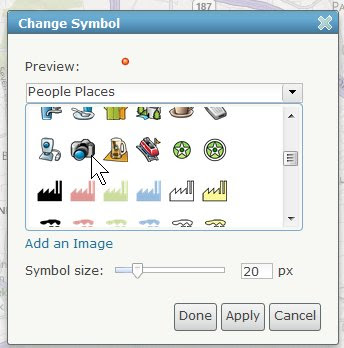
Then click the Change Symbol button. In the Change Symbol popup window, I like the camera in the People Places font:

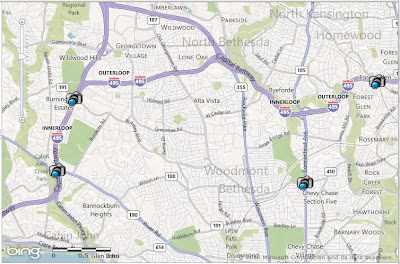
Select it, click Apply, click Done, and click the X to close the Change Symbols section:

When you click on a camera, you get its info window:


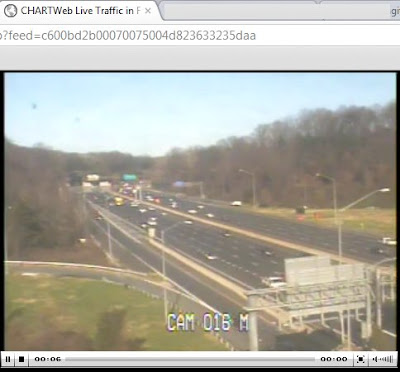
The program is smart enough to include the url field – click on More info and the traffic cam appears in a new tab (if you right-click on More info, you can select Open link in new window, allowing you to have multiple windows open at the same time).

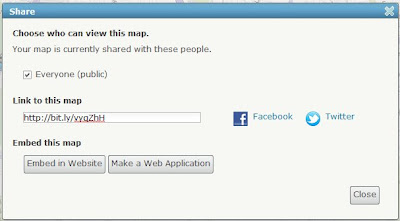
To Share this map, you must Save this map. To Save this map, you must Login/Sign In to your account. After Signing In, I can Share this map with Everyone:

Here is the url link to map
Additionally, I can Embed in Website or Make a Web Application – sounds like tomorrow’s blog!

Thursday, December 8, 2011

12/8/2011 Traffic Cams, part 1 (too much NCIS?)

Maybe I’ve been watching too much NCIS, but when I was looking at the Maryland Department of Transportation website for Coordinated Highways Action Response Team (their Interactive Mapping page)
link to Interactive Mapping page

I was fascinated to see a link to Live Traffic Cameras (what is the traffic – out there/rightnow!)

Ouch – what a boring list, and totally unhelpful for someone not familiar with the area. It says “To view cameras from a map interface please use Interactive Mapping.”

So I went back to the Interactive Mapping page, and clicked the Video/Camera tab:

Living in the Boston area, I have a natural desire to look at, but not be involved in, traffic. Zoom-in on the area north of Washington, DC, and select the Video Camera at I-495 & River Rd (MD 190)

Up pops a web-window with a live feed:

And, yes, that is a url
http://www.chart.state.md.us/video/video.asp?feed=c600bd2b00070075004d823633235daa
Click on it, and you get your own live-link to "I-495 - RIVER N"!
If you work off the Interactive Map, the single pop-up window gets replaced for each camera you click on. But if you grab each url, you can have multiple windows open!
I-495 W OF MD-97
I-495 AT BRADLEY BLVD
MD-185 - MD-410 N

At the Northeast Arc Users Group Conference in Saratoga Springs, NY a few weeks ago, I saw a presentation populating the info boxes on Google Maps with pictures and urls. Which means that I should be able to have these video feeds just appear on the maps! Sounds like a great project for tomorrow’s blog.