WHAT!!!!
Of course I have heard of sinkholes, but I thought they were very far-and-few-between – the stuff of headlines:
GERMANY - A giant sinkhole under a residential street opened up on Monday in central Germany. ...
GERMAN SINKHOLE link
GYPSUM (AP) - Sinkholes have been popping up near long-abandoned mines along a busy Lake Erie highway, and the state plans to fill in some of the tunnels before the holes reach the road. ...
Sinkholes near Gypsum prompt monitoring link
but, living here in relatively-geologically-stable New England, I think that “sinkhole insurance” is about as necessary as “elephant-through-your-living-room insurance”. But maybe Florida is different – let’s use our GIS resources and knowledge to investigate!
Because the tool is there, and so easy to use, let’s “Google Map” the house: 34606 Parlow Avenue, Spring Hill, FL:
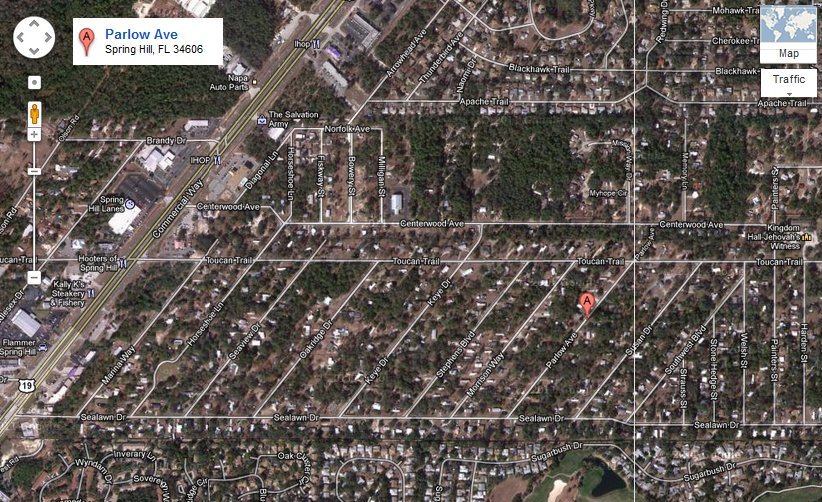
And let’s zoom out to see the major highways on the east (589) and the west (19):

Also because it is easy to use, let’s Google “database of sinkholes”. Maybe Google knows I’m a GIS guy, or maybe I’m just lucky, but the first hit looks promising:
FGS, Sinkholes in Florida
webpage link

It is the Sinkholes page for the Florida Department of Environmental Protection – certainly a trustworthy source! Scroll down to the bottom, and in the Sinkhole Resources section, download and open Florida’s Sinkholes (Poster No. 11) Contact FGS to purchase this 24” by 36” poster

Depending on the size of your computer monitor, this is a pretty scary poster! Especially when you realize that Spring Hill is on the west coast just north of Tampa Bay! Let’s try to find some Good News.
First, though, what county is Spring Hill, Fl in? Wikipedia says that “Spring Hill is a census-designated place (CDP) in Hernando County, Florida”. We will see below that is a good assumption.
Back on the Sinkholes page, scroll down to the bottom, and in the Sinkhole Resources section, download and open Sinkhole type, Development and Distribution in Florida Map (Map Series 110). This is a beautiful thematic map of Florida, produced by the USGS in 1985, with soils divided into four areas related to sinkhole type:

Zoom in on Hernando County:

And we see that Hernando County has three-of-the-four areas:
Yellow is Area I – “Sinkholes are few, …”
Green is Area II – “… Sinkholes are few, …”
Blue is Area III – “… Sinkholes are most numerous, …”
So where is our property in Hernando County, in relation to these yellow/green/blue areas???
Open MapInfo, and open a County file, and open a Streets file, and zoom-in on Hernando County:

I have put a Gold Star in the area of the house. Comparing it with the USGS map, it looks like the house is in the green area under the “H” in “Hernando”. That’s Good News!
Maybe I should leave well enough alone/let sleeping dogs lie, but let’s see if there is a database of actual sinkhole locations. Back on the Sinkholes page, the left column has a Data & Maps link. Click it to get to the Data and Maps window:
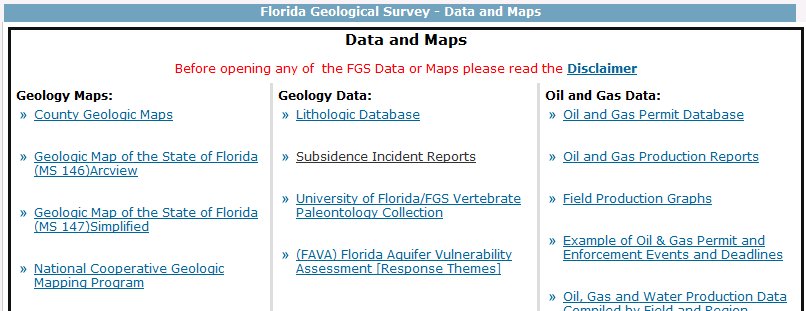
By now, I realize that “sinkholes” are also referred to as “subsidence incidents”, which sounds much nicer. Click on the link for Subsidence Incident Reports to get to the Subsidence Incident Reports page:

Scroll down, and download the ESRI ArcGIS compatible shapefile. Unzip the file and bring it up in the MapInfo screen you worked on before:

Um, I don’t feel so happy anymore – there are sinkholes (“subsidence incidents”) all around the new house! Maybe the USGS should update its map/geologic database. Let’s make a copy of the sinkhole file (only County = “HERNANDO”, and only the oyear column [original reported year]), bring it up, and color the dots by oyear. This will allow us to see if the sinkholes happened back in the Sixties or Seventies, or if they are more recent:

Well, most happened in the 1990’s. Zoom-in on the house:

Using a radius tool, we see that the closest reported sinkhole is purple 0.4 miles to the west, and the closest red one is 0.6 miles to the northeast. I guess it is time to call the insurance company and get some “sinkhole insurance”.


