- as an American, I want to be aware of the ever-changing economic and demographic profiles of our society,
- as a person, I want to know how our society will deal with its problems, including poverty, and
- as someone who deals with data, I want to understand data, and understand and implement the most effective methods to transform that data into information.
The New York Times article
The online New York Times article consists only of text, plus four hyperlinks (“the report”, “The Truly Disadvantaged”, “Center on Poverty, Inequality and Public Policy”, and “earned income tax credit”) [the print version, of course, does not have even the hyperlinks]. Although there are mentions of geographic places (“Midwestern: Toledo and Youngstown in Ohio, and Detroit”, and “Sun Belt areas like Cape Coral, Fla., and Fresno, Calif.”), there are no accompanying maps or visualizations.
Just as it is important to discuss regional differences (Europe, Japan, North America, etc), and not just the entire “global economy”, an important part of the story of Concentrated Poverty in America is regional differences within the United States.
I went to the Brookings Institute website to both view their presentation of the Report, and to download the Report itself. Brookings link
The Brookings Institute Report
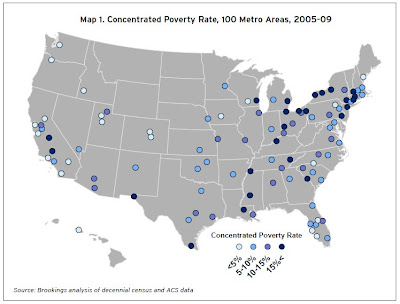
Before discussing the website, let’s look at the pdf Report. The 35-page report includes bar charts, number tables, a nationwide map, detail maps for Detroit, Dallas, Chicago, and Atlanta, appendices with the raw data, and two pages of endnotes.
The nationwide map shows colored dots (“circles that are all the same size”) over a map of the states. The dots are colored into four ranges, depending upon their “Concentrated Poverty Rate, 2005-09”. The colors are a good intuitive blue-color ramp (darker = more), but I would like to see the “count of areas” next to each colored dot in the legend:
15%< [24 areas] means there are 24 metropolitan areas with Concentrated Poverty Rates Greater Than 15%
As for the “circles that are all the same size”, welcome to “Displaying Data 101” – sometimes there is too much data to display on a single (static) map. In this case, because of the great number of metro areas in the Northeast, you can only see them all if they are relatively-small symbols (circles, squares, diamonds). Using different symbols for size variables could be used, but it might just make the map too busy.

Examining the map makes me wonder about applying Spatial Statistics to the data – examining each set of colored dots just gives me a “random” feeling, but that can certainly be validated through examining the Spatial Distribution of the data (and each data set). Another blog for another time.
The Brookings Institute online article
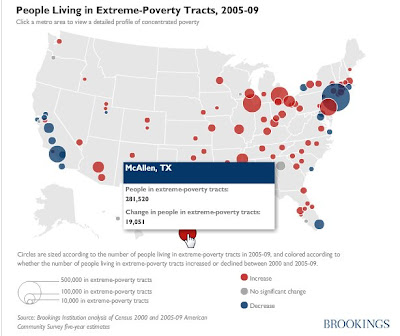
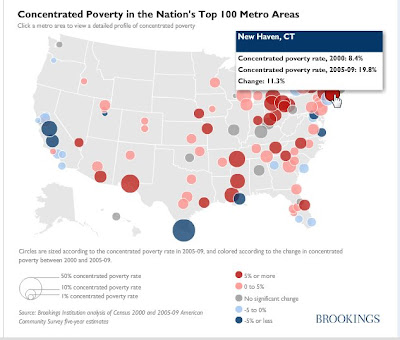
The Brookings online article is longer than the New York Times article (606 words versus 488 words), and includes the (linked) ability to “find concentrated poverty statistics for your metropolitan area”, plus a video. There are also two very nice maps of the 100 largest “metropolitan areas” in the United States. Although the maps are static (there is no slider to show changing data-over-time), the white non-outline of the light gray states provides the perfect background for the multivariate data.
Map 1 shows
- latitude/longitude location,
- size of circles equals current counts of people living in extreme-poverty census tracts, and
- color of circles indicates increase/decrease change from Census2000 data.
Additionally, the webpage takes advantage of the user interface, and offers the user a “hover over” ability – when you hover over a metro area, a detail popup appears with statistics relating to that metro area:

Map 2 shows
- latitude/longitude location,
- size of circles equals current level of Concentrated Poverty Rate, and
- color of circles indicates increase/decrease change from Census2000 data.

My next blog will discuss taking the data from the pdf Report into an Excel spreadsheet, then into Tableau Software for visualization over time.
No comments:
Post a Comment